The European Growth Opportunity

European VC funding has grown 502% since 2013
At a surface level, 2023 was another down year for European fundraising following the 2021 heights. Total funding raised reached USD 55.5 billion, down c. 50% on 2021 and close to 40% down on 2022 funding. With turbulent geopolitical conditions and high interest rates contributing to unsteady macroeconomic conditions, higher-risk asset classes including venture capital and growth equity both received reduced investor attention. However, to really put the developments in the European funding market into perspective, it is critical to look at the longer-term picture.
Data from Dealroom suggests that from 2013 to 2023, European funding increased five-fold, outpacing the US ’relative growth by a factor of more than 2x. While it is no secret that Europe does not (yet) boast the US’ hall-of-fame lineup of +$100 billion market cap tech companies, it does highlight the strong secular growth trend that has been transforming Europe in the last decade.
European early-stage deal activity near US-levels, generating strong deal pipeline
The continuing maturity of the European market can be clearly observed when looking at deal activity across stages.On the early-stage side, Europe substantially outperformed the US in deal growth from 2013 to 2023, adding 1.9k deals(+48% growth) versus the US’ 1.3k (+17% growth) over the period. While ten years ago the US was home to 1.7 early-stage deals per comparable European deal, this number has in the meantime reduced to 1.3x, with Europe even temporarily surpassing the US in 2019 and 2020.
This growth has led to the build-up of probably the strongest ever pipeline for European later-stage investors such as HPE. Simultaneously, on the late-stage side, the continuous catch-up to the US is even more pronounced. In 2013, there were more than twice as many late-stage & growth deals in the US compared to Europe.By 2023, this gap had narrowed down to only 1.4x, clearly evidencing Europe’s development into a mature venture market.

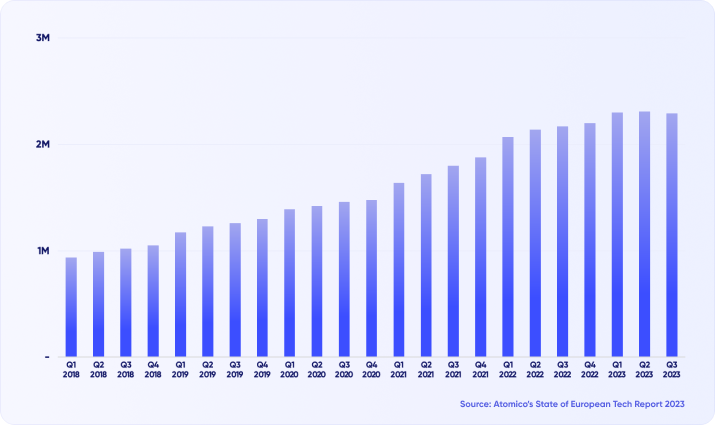
1.3 million new employees in the European tech ecosystem in the last five years
The momentum behind European tech is even better illustrated from a human capital perspective. In only five years, European tech has expanded its collective workforce from below 1.0 million to 2.3 million FTE. Importantly, this growth period also spans the cyclical layoff spree which occurred across tech in 2022 and 2023. As Europe’s ecosystem has evolved, cohorts of new founders have been spun out of European unicorns at a never-accelerating pace, driving growth in deal opportunities that will ultimately lead to a further influx of talent into the ecosystem.
Combining the powerful network effects of the maturing European market with the talent produced by Europe’s world-class educational institutions in key entrepreneurial disciplines such as computer science, Europe’s wealth of human capital underpins the growth potential of its tech companies.
European GPs participation in European growth deals up 15% (2021 - 2023)
While the growth pattern of European tech has been characterised by consistent acceleration, the composition of its capital providers has been less uniform. Despite the strong historical presence of US investors in European tech, the macro concerns driving the 2022/23 VC downturn promoted a decrease in cross-regional capital deployment.
As a result, US investors deployed increasing capital in domestic assets, with their participation in European growth stage funding rounds falling from 39% in 2021 to25% in 2023. While the – most likely temporary – reduction in US involvement is no good news for the ecosystem per se, it is promising to see that European growth investors stepped up to the challenge, increasing growth deal participation to 63% of all growth deals in 2023, up from 48% in 2021.
Not only does this confirm that the European market has deepened materially at the later-stages, it is also likely to fuel the overall European ecosystem as an increasing share of proceeds from successful European exits will get distributed to EuropeanLPs and ultimately be reinvested in the ecosystem further promoting a culture of innovation.

Despite only 35% more deals in the last decade, the US saw 3x the funding of Europe
Despite this positive momentum the European market continues to attract significantly less capital than its US counterpart. In 2023, the US saw roughly 2.8x the funding volume of Europe and US GPs were sitting on c.3x the dry powder of European GPs. This gap has had two key consequences for European GPs.
Firstly, the European liquidity gap paired with the generally challenging global fundraising environment in2022 and 2023 have driven an emphasis on capital efficient growth within most European tech companies.In our 2023 Summer Newsletter we emphasised the seismic shift from the ‘grow-at-all-costs’ trend of the low-interest rate vintage to the ‘survive-at-all-costs’ mentality promoted by cautious capital deployment.
As a result, 2022 and 2023 saw widespread OPEX reductions across European tech companies. Consequently, the current pipeline of efficiently growingSeries B+ European tech companies who survived the ‘VC winter’ have a significantly more capital-efficient growth profile than historically seen at Series B, providing attractive entry opportunities for GPs.
Secondly, the European market tends to be less competitive from a GP perspective. While the absolute deal count across all VC stages was only 35% more in the US over the last decade, the US saw close to three-times more funds raised in the same period and is home to three-times the current dry-powder of Europe.
Our analysis of Pitchbook data suggests that, post-seed stage, there is on average 2.3 times more deals per GP in Europe than in the US – a quota that has remained relatively stable over the years despite increasing competition in both markets. Historically, this discrepancy has led to a circa 30% valuation discount in Europe at the Series B stage, providing an interesting entry arbitrage opportunity for European GPs.

Capital efficiency premium in equity markets at five-year high
Not only is capital efficient growth more attractive from an investment perspective, but it has been similarly rewarded by stronger valuations in equity capital markets.
The premium at which publicly listed companies trade with capital efficient growth (reflected by a positive ‘Rule of 40’ growth rate), is at a five-year high. This represents a 63% premium to companies who don’t meet the Rule of 40 Criteria (EBITDA margin + annual revenue growth being 40%).
The best European tech companies do not trade at a discount
When comparing European and US equity capital markets, it’s clear that in tech European markets pale in comparison by size. In the recent quarter, HPE conducted proprietary research of the top 20 listed companies in European and US public markets with a mostly digital earnings model, finding that the aggregated market cap of the US pool was more than 21x larger than that of Europe.
However, a more interesting conclusion of our research was that the European digital pool in question traded at comparable, and sometimes even higher multiples (EV/Revenue and P/E ratio) throughout the period.
Thus, while European tech will not displace the US by volume or global preach any time soon, the European tech ecosystem does present investors with a unique opportunity to support capital-efficient, innovative companies on a significant growth path, and achieve strong returns while doing so.

Featured Articles

The European Growth Opportunity

Why our approach works in the market?

Sustainable Growth in Technology

